

VIETNAM SECTOR ROTATION & ALLOCATION OUTLOOK
Executive summary
Vietnamese equity sector leadership has almost no year-to-year persistence: last year’s winner tells you very little about this year’s. Our research shows that annual sector rankings are driven mainly by the macro regime—funding costs, oil, single mega-cap stocks, monetary conditions, and liquidity—rather than by sector trends themselves.
The 2026 regime is investment-led high growth, with supply-side inflation that has not yet peaked and structurally tight funding. In this environment, we favor businesses that collect rent from FDI manufacturing, hold scarce licenses, earn USD, or have access to policy-directed credit. We are cautious on real estate, brokers, and banks with heavy property exposure. Within banks, we are selective and prefer low-cost deposit franchises.
That matters because financials and real estate dominate market capitalization, and the marginal buyer is a leveraged local retail investor facing 13–14% margin rates against deposit offers above 8%. The FTSE upgrade does not change this: foreign flows are driven by US rates and the AI trade, not index inclusion.
Allocation stance:
In a 2026 environment of high leverage, sticky rates, and tolerated inflation, we prefer businesses whose revenue does not depend on local credit, and we avoid segments where credit risk ultimately lands.
– Underweight real estate, brokers and banks with heavy property exposure.
– Neutral and selective on banks, favoring low-cost deposit franchises.
– Prefer businesses that collect rent from FDI manufacturing (industrial parks, ports, power), scarce-license construction materials, USD earners, and policy-priority sectors with access to directed credit.
– Hold some cash and deposit buffer.
Historical sector rotation
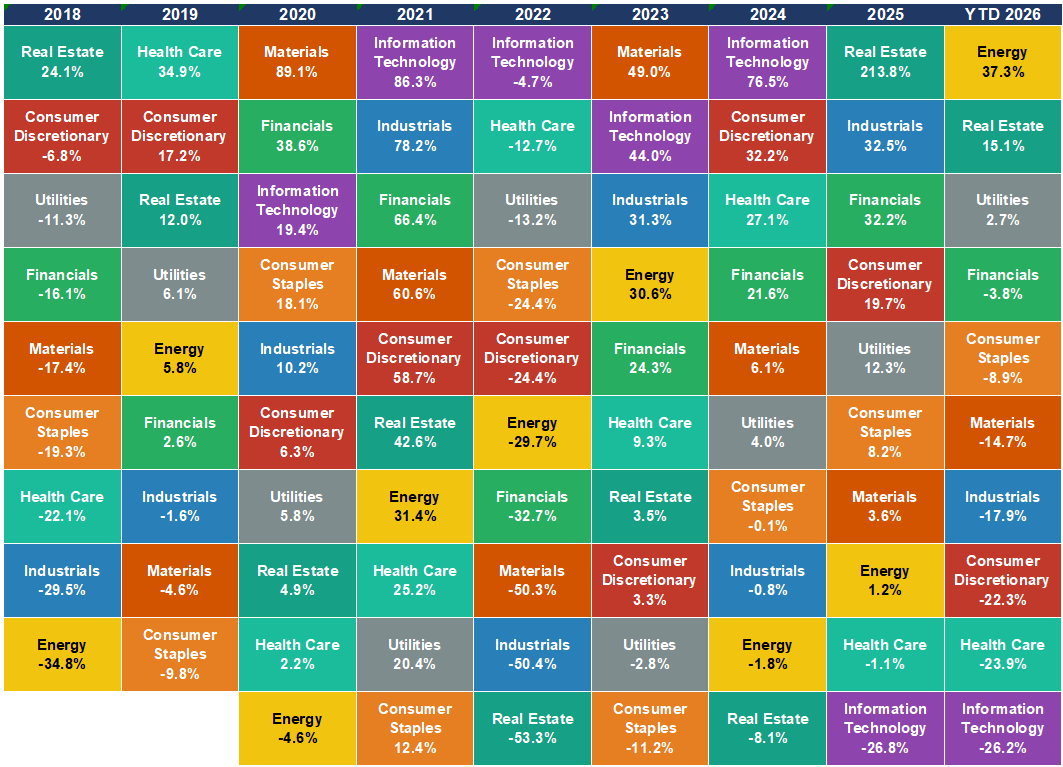
Sector leadership does not persist from one year to the next. The Spearman rank correlation between consecutive years swings between +0.53 and −0.70 and averages close to zero. Chasing last year’s winner has been a coin toss at best.
ANNUAL RETURNS BY HOSE GICS SECTOR (2018 – YTD 2026)
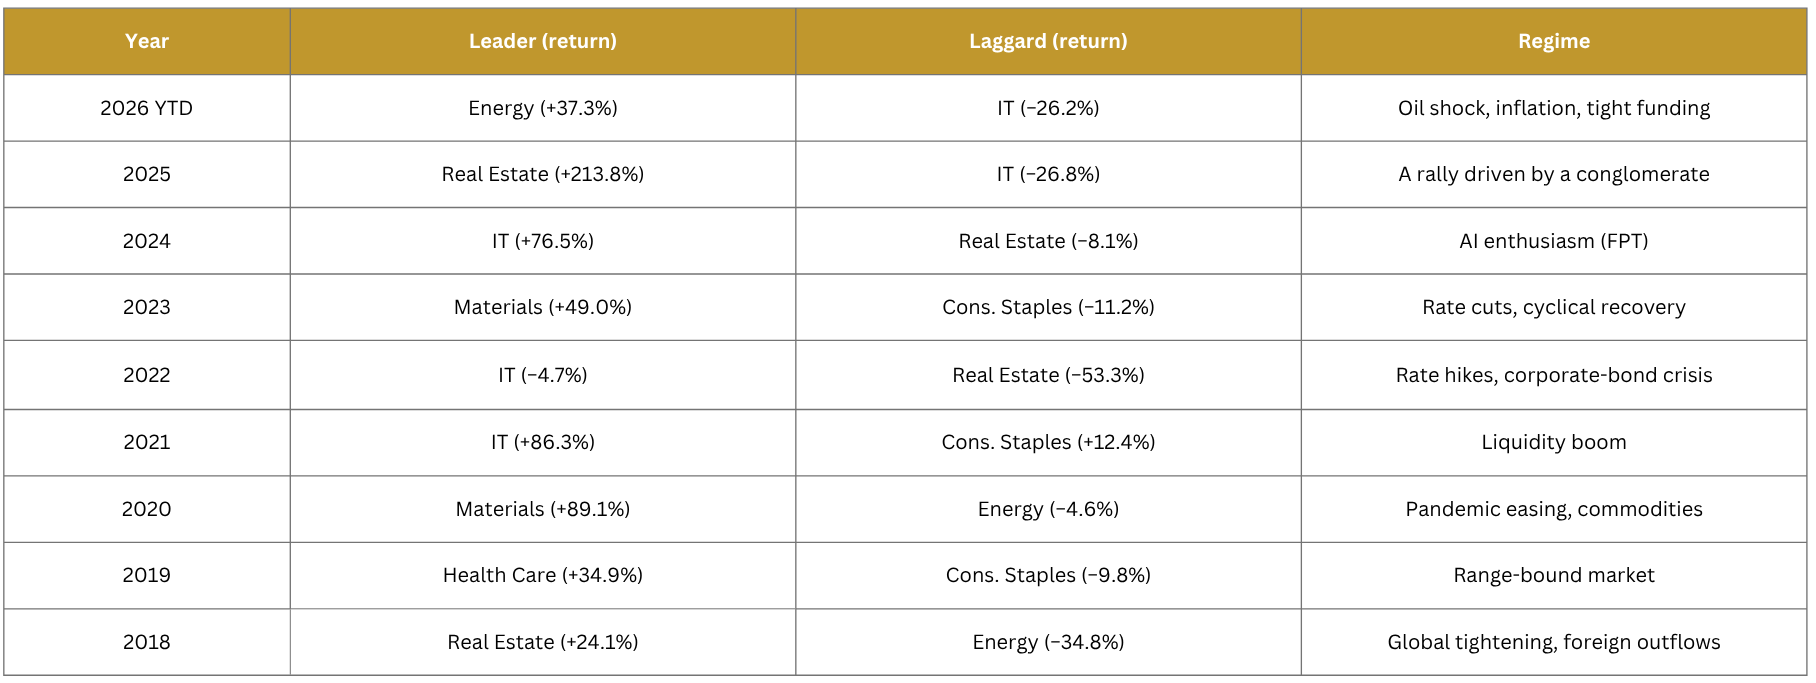
Leadership is set by the macro regime
Each year’s leader maps to a recognizable regime, and reversals are frequent. IT ranked first in 2024 (+76.5%) and last in 2025 (−26.8%); real estate went from −8.1% in 2024 to +213.8% in 2025.
Long-run winners and losers
Financials are the best long-run compounder: never first, but second-best average rank and the highest cumulative return, with less than half the volatility of real estate. Real estate’s cumulative gain comes almost entirely from 2025. Consumer Staples is a structural loser, down 36% since end-2017.
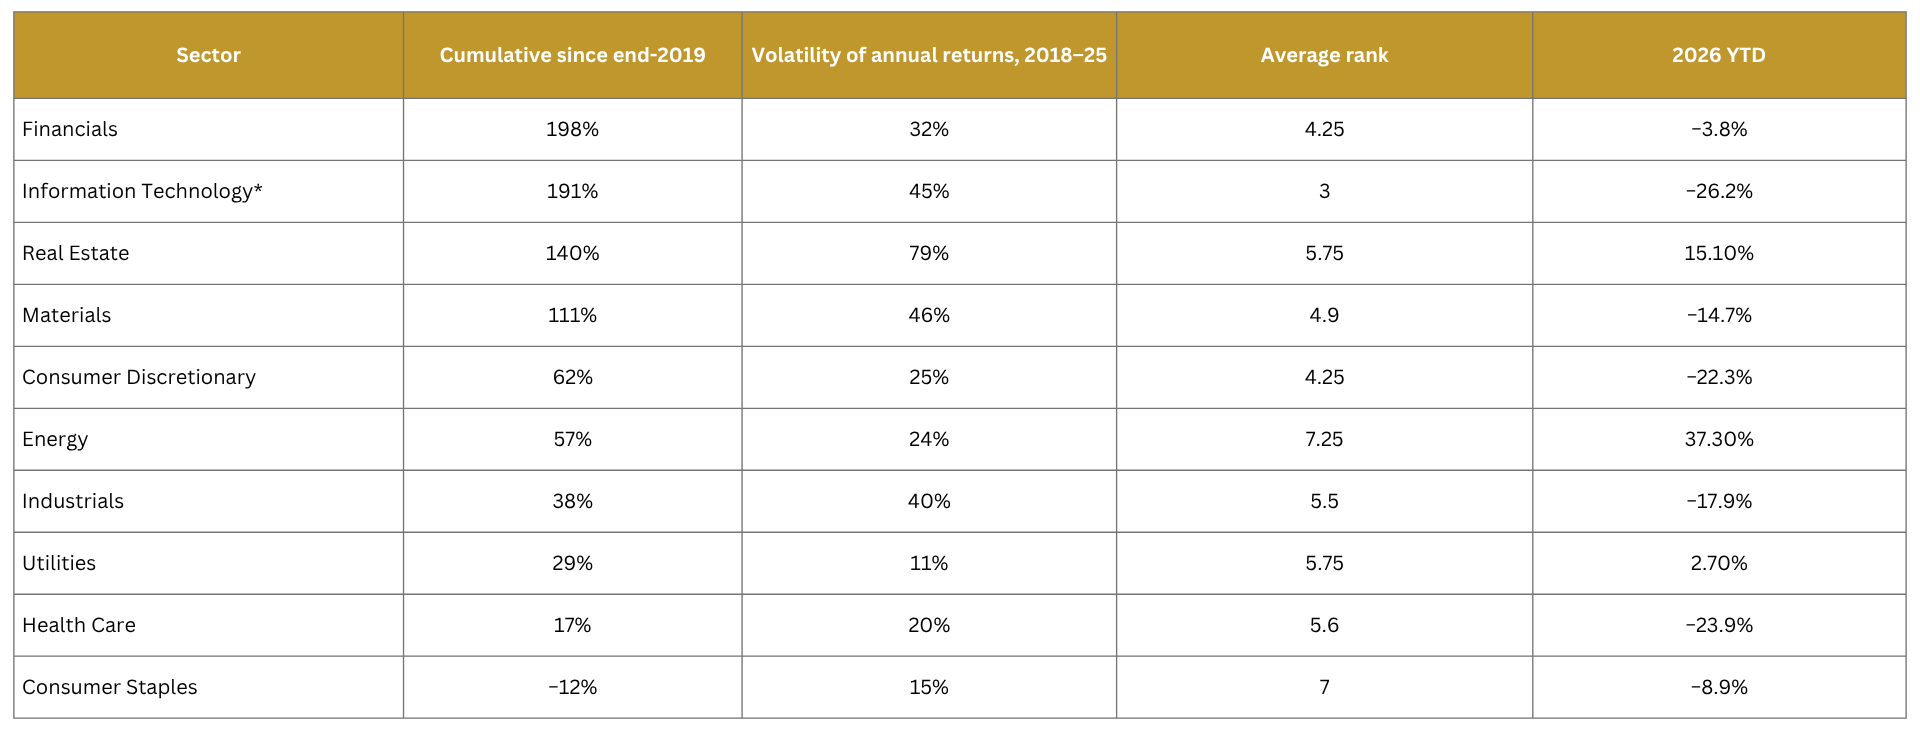
Source: Fiinpro, PHFM compiled
Concentration distorts the sector picture
Sector indices are dominated by a few stocks: VNREAL is largely the Vingroup family and VNIT is largely FPT. In 2025 the gap between the best and worst sector reached 241 percentage points. In 2026 only 3 of 10 sectors are up and the median sector is down 11.8%, so a flat-looking VN-Index hides broad weakness. IT and real estate returns were negatively correlated (−0.42, 2020–25), which offers some diversification.
Macro backdrop, first nine months of 2026
Growth is strong and investment-led, but inflation is rising and funding is tight. Q3 GDP grew 9.95% year on year, taking 9M growth to 9.01%, the fastest in 15 years. Hitting the 10% full-year target would require Q4 growth above 12.5%.
The trade data show who captures export growth. In 9M 2026 the domestic sector ran a US$34.3bn deficit while the FDI sector (incl. crude oil) ran a US$14.9bn surplus. FDI firms account for 80.7% of exports, and 94.1% of imports are production inputs. Export gains therefore flow mainly to foreign-owned manufacturers, not to listed domestic companies.
Inflation pressure is supply-side: fuel prices averaged +10.89% in 9M, and September’s increase was driven by fuel and school fees. That leaves the SBV squeezed between a growth target and an inflation ceiling it has already breached.
Structural constraints: why local rates cannot fall
Vietnam has neither the room nor the tools to guide interest rates lower in the near term. The 10% growth target is being pursued with credit and public spending, at a time when savings are not keeping up and global rates are rising.
An investment-led, credit-intensive model
– Leverage is already high. Credit reached about 145% of GDP at end-2025 and is forecast near 155% in 2026. At roughly 16% annual credit growth, the ratio would pass 180% by the end of the decade.
– The plan raises investment intensity. The government targets investment of 40% of GDP on average during 2026–2030, up from 34%.
– Prudential rules are being loosened to fund it. From 1 July 2026 the cap on using short-term funds for medium- and long-term lending rose from 30% to 40%, widening maturity mismatch.
– Public borrowing competes for capital. Ten-year government bond yields rose from about 4.0% in January to 4.67–4.80% at September auctions, the third straight monthly increase.
– There is no deep corporate bond market to relieve the banks, so deposits are the binding constraint. Banks are issuing bonds at 9–10% to fund year-end lending.
The key difference from China: the debt sits in the banks
Public debt is only 35–36% of GDP, and most FDI goes to manufacturing rather than property or local-government vehicles. That gives the state fiscal room. This shifts risk directly to balance sheets of listed banks and developers, reinforcing the need to move away from pure cap-weighted indices toward defensive, credit-resilient cash flow compounders. Vietnam’s leverage sits on bank balance sheets, so if it unwinds, the losses land first on banks and real estate, the two sectors that dominate listed market capitalization.
The SBV’s dual-track response
Rather than cutting rates across the board, the SBV is running two tracks. Priority sectors and large projects receive directed credit at 1–3.6 percentage points below market, and some big projects are exempted from credit quotas. Everyone else pays market rates. Q4 guidance tightens credit to risky sectors such as real estate.
The likely outcome is tolerance of inflation and a gradually weaker Dong rather than a rate hike. With CPI at 5.08% and the average deposit rate at large banks near 6.9%, real deposit rates are below 2%.
Market structure, local liquidity and foreign flows
The Vietnamese market is priced by leveraged local retail investors, so local funding costs matter far more than foreign flows or index events.
Rate-sensitive market, leveraged buyer
Rate-sensitive weights. Financials and real estate make up the bulk of market cap. The Vingroup group alone is about 30% of HOSE market cap and 20% of turnover, up from 7% and 2% at the start of 2025. While financials remain Vietnam’s premier long-term compounding sector historically, the current tight-funding regime demands strict differentiation between low-cost CASA franchises and property-burdened lenders.
Record margin debt. Brokers’ margin loans reached about VND435 trillion at end-Q2 2026, a record and up VND30 trillion in one quarter. Margin rates at some brokers have risen to 13–14%.’
Deposits compete hard. Headline 12-month deposit rates range from 3.7% to 7.8%, but including bonuses and promotions, at least 13 banks offer effective annualized rates above 9%. For the rate-savvy investor who also trades on margin, 9% is the real opportunity cost.
The equity risk premium is thin. In the end of September 2026, the market trades at 12.9x 2026F P/E, or 9.6x excluding Vingroup, implying earnings yields of about 7.8% and 10.4%. The headline earnings yield is below the 9% deposit rate; excluding Vingroup, it is about 10.4%, leaving only about 1.4 percentage points of premium.
The FTSE upgrade is unlikely to be a major near-term flow catalyst
Vietnam moved to FTSE Secondary Emerging on 21 September 2026, but the first tranche disappointed. The VN-Index fell 3.47% in September, and foreigners sold about VND7.8 trillion on HOSE between 21 September and 2 October. Year to date, foreign net selling is about VND95 trillion.
– Inclusion is phased and small. The 27 stocks enter in four steps: 10% (21 Sept 2026), 20% (22 Mar 2027), 35% (21 Jun 2027) and 35% (20 Sept 2027). Passive money tracking FTSE EM is modest.
– A “frontier-fund rebalancing” explanation appears unconvincing. Frontier money is benchmarked to MSCI, and MSCI still classifies Vietnam as Frontier; it did not add Vietnam to its watch list in June 2026. FTSE Frontier tracking assets appear relatively limited.
– The main selling pressure came from macro and event-driven. They include the Fed hike and stronger dollar, the global rotation into AI markets, investors who pre-positioned for the upgrade (conglomerate stocks led foreign selling on effective day), and stock-specific blocks such as PNJ and HDB.
– We do not expect active money to flow in quickly. Foreign-ownership limits, FX hedging and Vietnam’s small index weight are major binding constraints for foreign active funds. Foreign active funds can and do research banks across emerging markets, but real estate is the sector where local opacity genuinely deters foreigners.
– The meaningful prize is MSCI EM, and it is years away. We would not rule out similar pre-inclusion run-ups and post-inclusion selling at future FTSE tranches.
Sector views
In a regime of high leverage, sticky rates and tolerated inflation, we favor businesses whose revenue does not depend on local credit and avoid those where the credit risk ultimately lands.
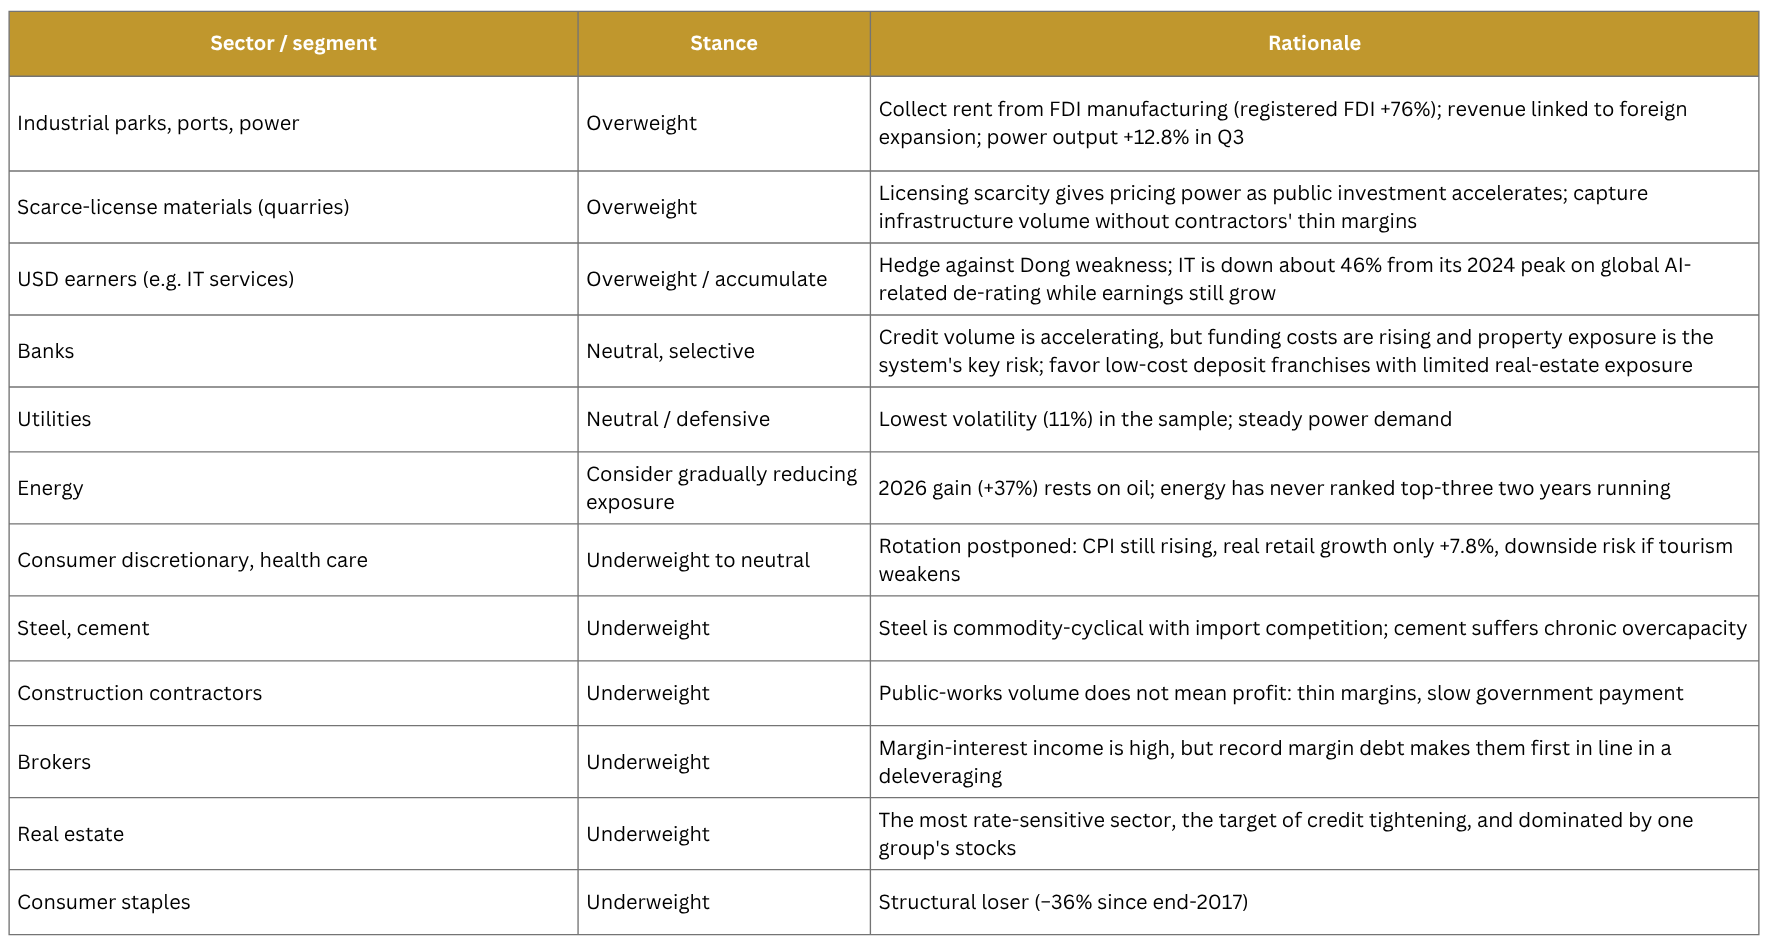
Asset allocation recommendations
Run a defensive core-satellite portfolio sized by risk, with a cash buffer, until local funding conditions turn.
1. We would not recommend allocating on sector momentum alone. Rank persistence is near zero, so buying last year’s winner is a bet that the regime will not change.
2. Build the core on businesses independent of local credit. Industrial-park and port landlords to FDI, scarce-license materials, USD earners and selective low-cost banks. Do not use “likely FTSE inclusion” as a selection criterion.
3. Use satellites for regime trades, with explicit triggers. Rotate into consumer discretionary and rate-sensitive financials only after the turning signals in the next section appear together.
4. Benchmark-aware concentration control. Stocks related to one group are about 30% of HOSE market cap, and sector indices are effectively single-stock bets (VNREAL ≈ Vingroup family, VNIT ≈ FPT). Check single-name exposure in any portfolio.
5. Rebalance with discipline. Because sector ranks reverse often, systematically trimming winners and adding to laggards has historically beaten buy-and-hold in this market.
6. Keep dry powder for forced selling, not for bottom-fishing. Index inclusion dates and margin calls create temporary dislocations. Historically, post-event dislocations have offered better observation points than chasing the pre-event run-up.
Risks and scenarios
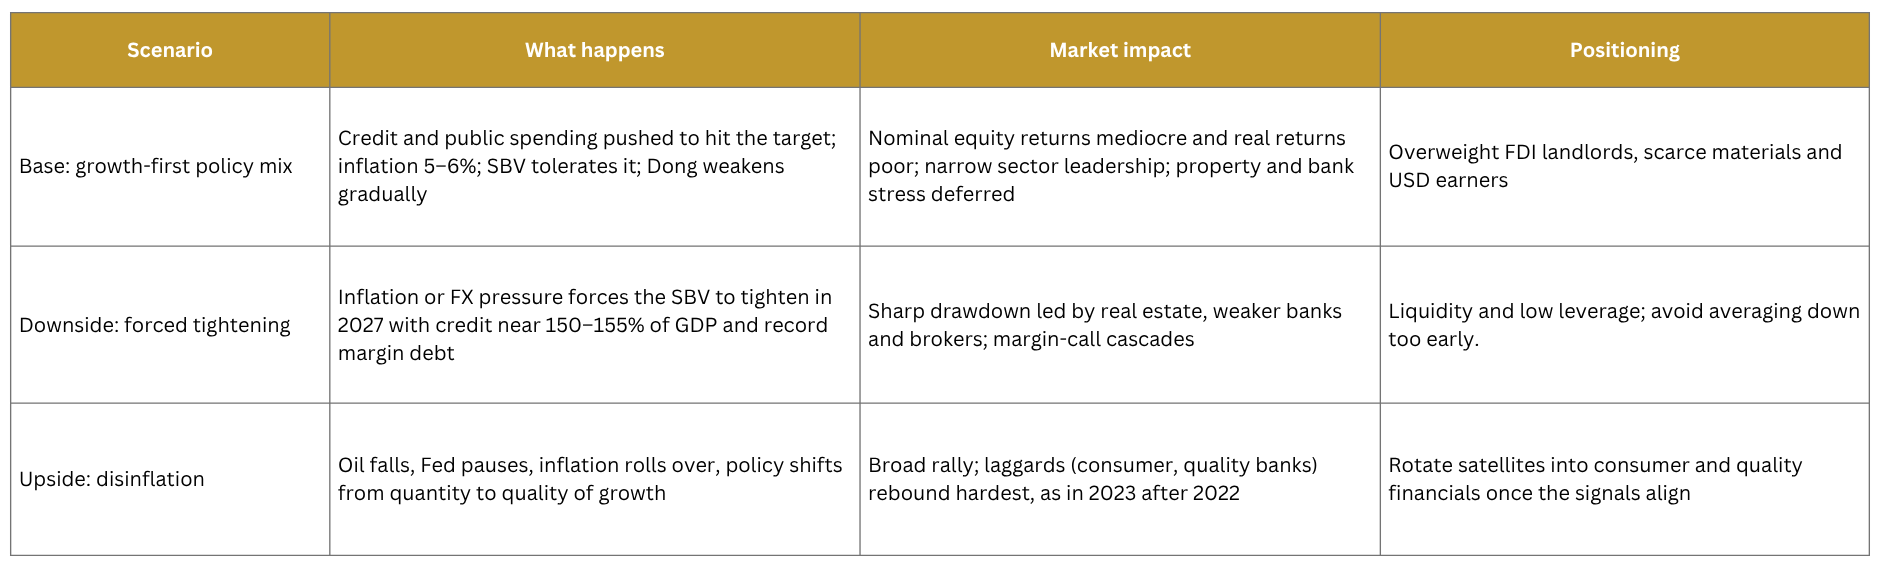
The base case is credit-intensive growth model: the 10% target is pursued with more credit and spending; inflation stays around 5% and the Dong drifts weaker. The tail risk is a forced tightening into a highly leveraged system.
Specific risks to monitor
Banking-system leverage: Credit near 150% of GDP, wider maturity mismatch after the July 2026 rule change, and property-concentrated risk.
Margin deleveraging: Record margin debt at 13–14% rates; a stock-specific shock can trigger forced selling, as the PNJ episode showed.
Single-group concentration: High weight concentration in one group means index moves can mislead in both directions.
Inflation and the Dong: Fuel-led inflation above target, a 9M trade deficit and a hiking Fed put pressure on the currency and on real returns.
Policy execution: The public-investment push may produce volume without profit, and a missed 10% target could prompt even looser credit.
Consumption fragility: Services consumption leans on tourism; a slowdown would expose weak domestic demand.
Index events: Each FTSE tranche risks a run-up and sell-off; MSCI EM inclusion is not imminent.
Investment Department, PHFM