INVESTING IN A K-SHAPED ECONOMY
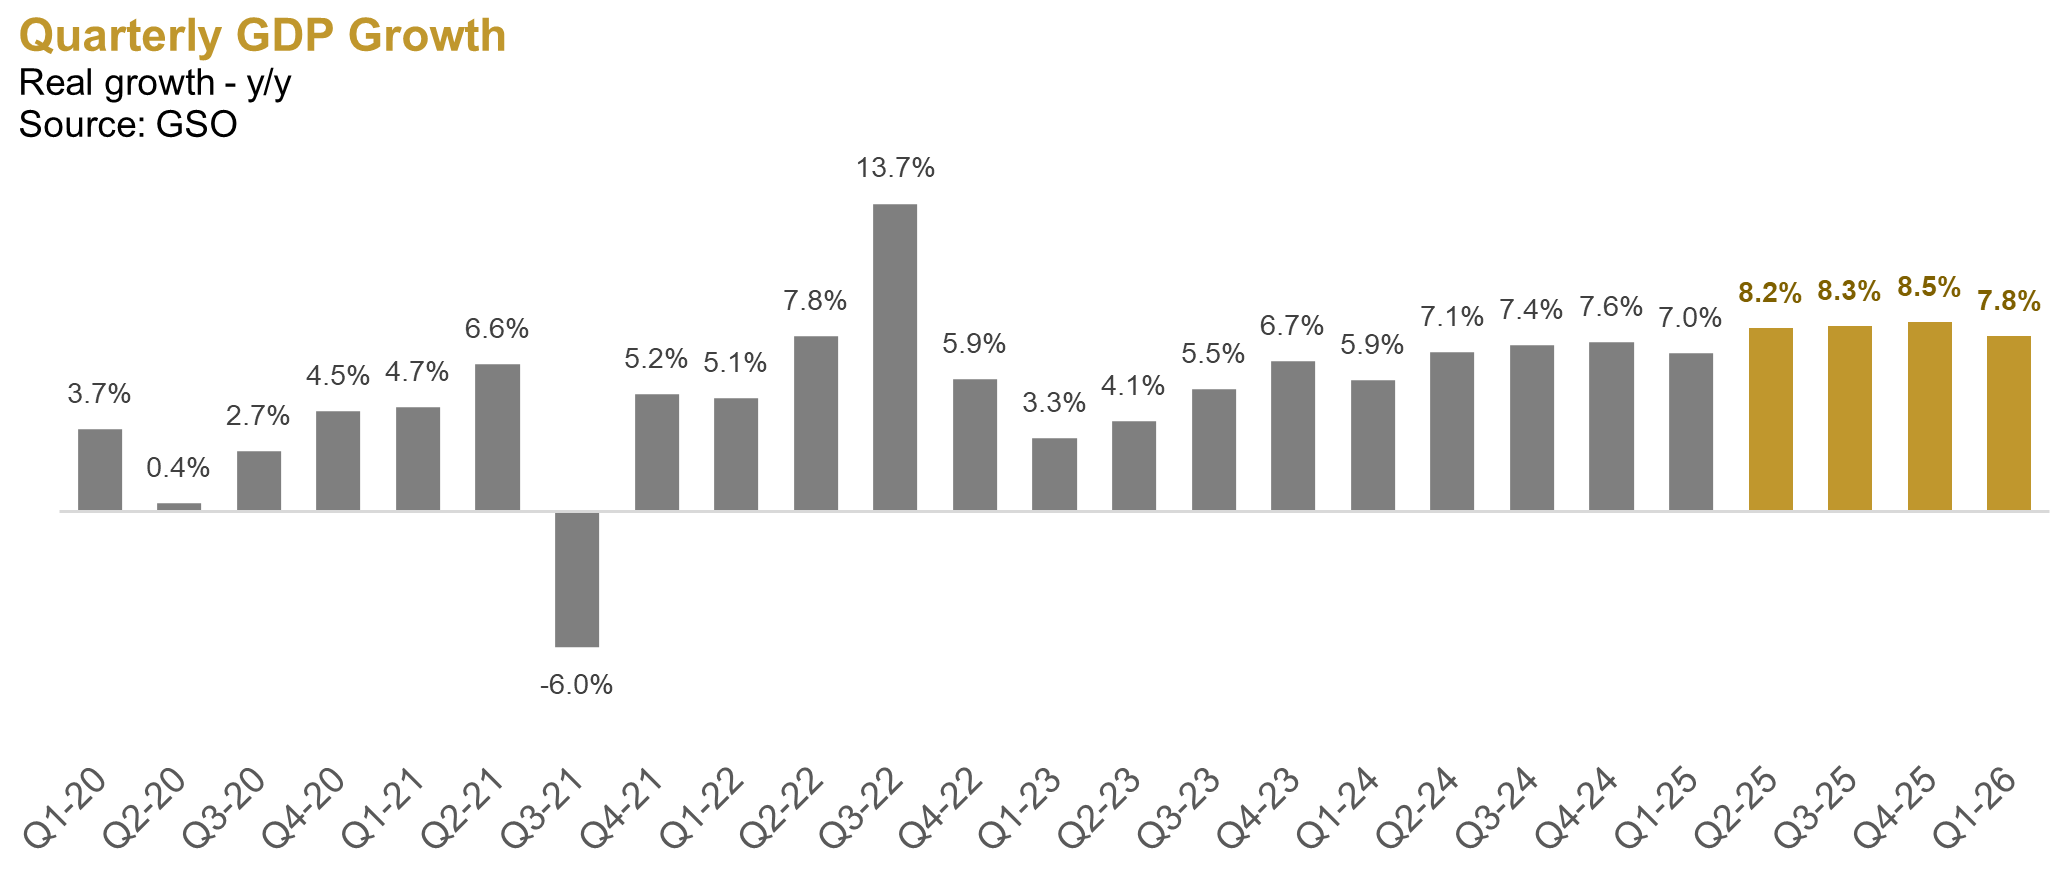
Investors are flooded with headlines of Vietnam’s stellar economic growth. Real GDP has hit five-year highs over the past four quarters (excluding the 2022 post-COVID rebound), cementing the country’s status as a global outperformer. Yet, a disconnect remains. For many, this “on-paper” prosperity hasn’t hit home, sparking skepticism over the data’s credibility. This phenomenon isn’t unique to Vietnam; from the US to Europe and Asia, the world is grappling with the same reality: a K-shaped recovery.
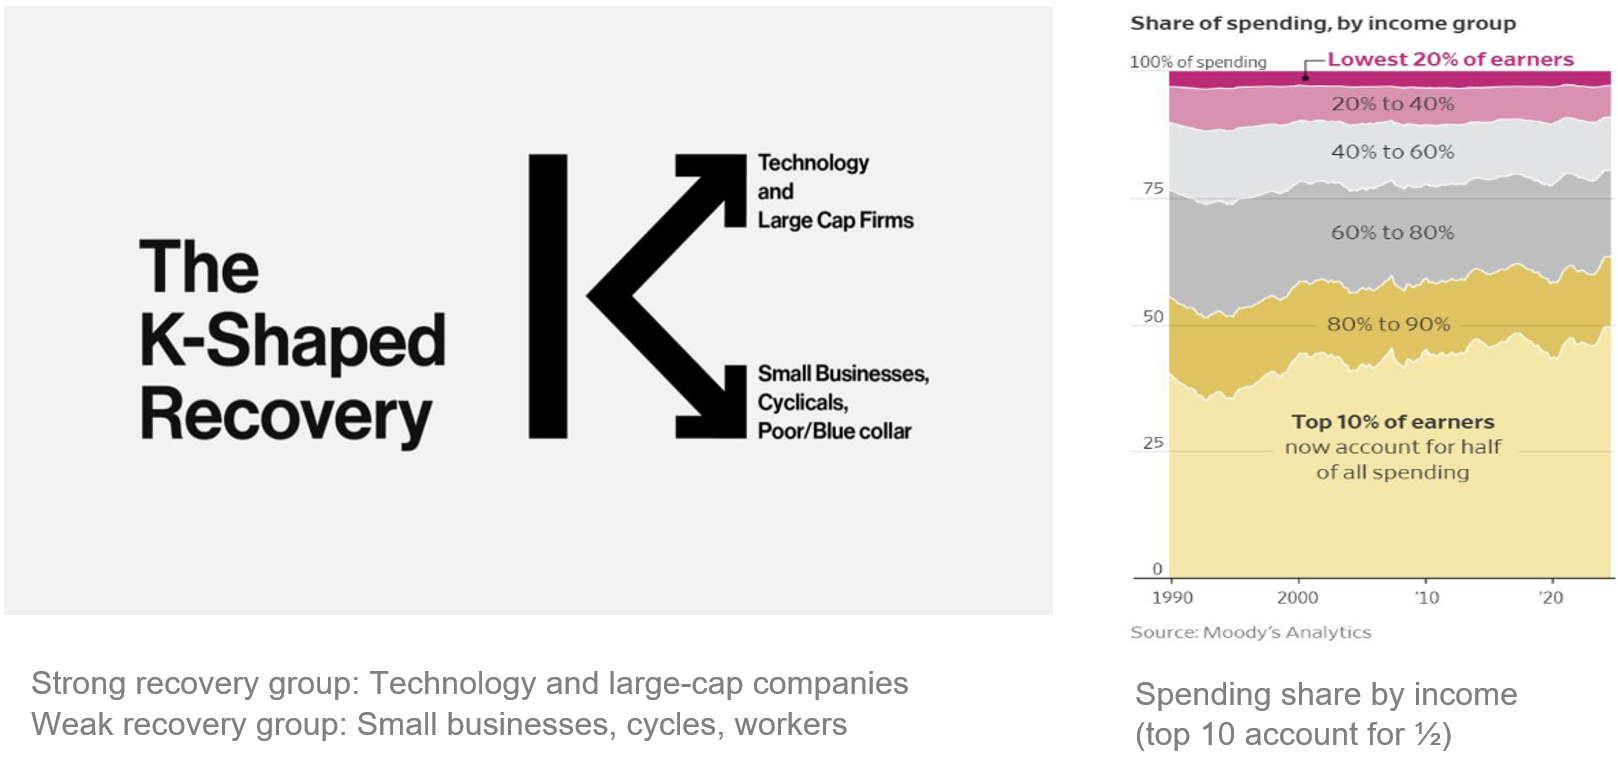
Originally coined in the post-pandemic era, the term describes a lopsided recovery across sectors and regions – where some outperformed pre-crisis levels while others remained stagnant. The trajectory of each industry hinges on localized dynamics and global headwinds; back then, aviation and tourism were the primary laggards in focus.
Today, the K-shaped model has evolved from a post-pandemic anomaly into a structural fixture of the global economy, defying early forecasts. In the U.S., ‘Big Tech’ and AI pioneers have emerged as the clear victors. We are witnessing a stark divergence: a segment of elite investors is ‘snowballing’ vast wealth through these high-growth engines, while the broader population remains sidelined, grappling with stagnant wages and volatile living costs.
A growing sense of a K-shaped recovery is taking hold in Vietnam. We point to two key developments that may explain this perceived divergence.
Growth is being spearheaded by the FDI sector and “national champions”:
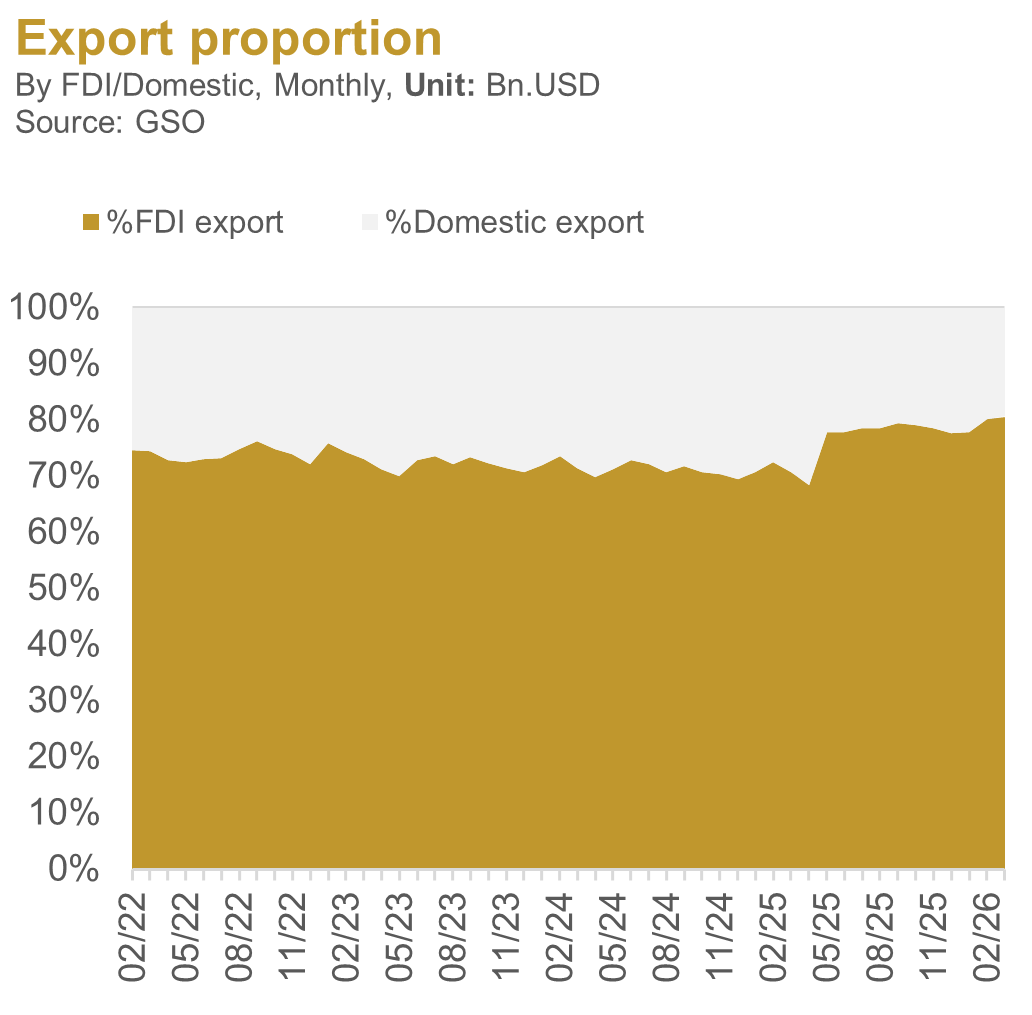
Following President Trump’s ‘Liberation Day’ (April 2, 2025), the U.S. slapped heavy tariffs on Chinese and global exports. Coinciding with this shift, the FDI sector’s contribution has surged since April.
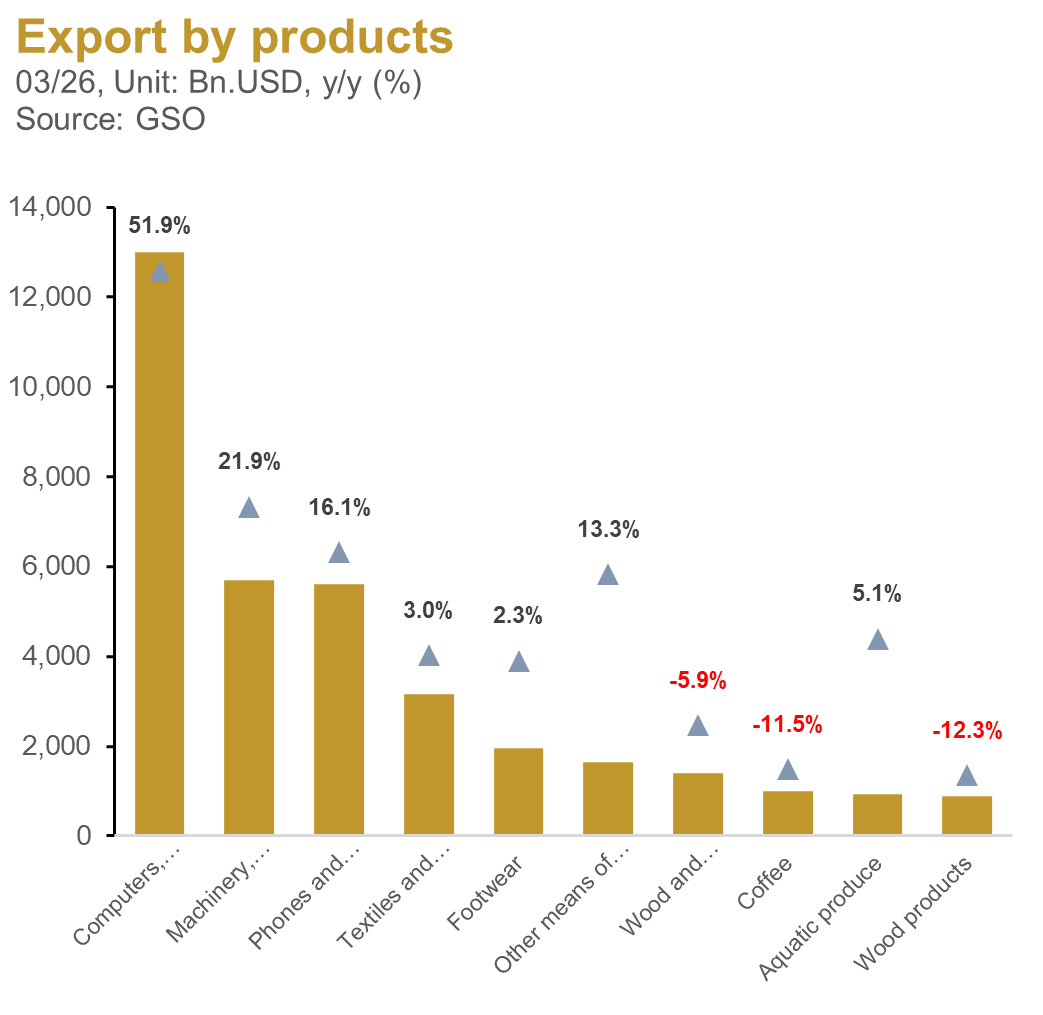
March 2026 export data highlights the dominance of electronics and handsets. These sectors have spearheaded growth since ‘Liberation Day,’ underscoring a deepening ‘China +1’ shift. This diversification trend remains the primary engine behind Vietnam’s resilient export performance.
The kicker: export growth is almost exclusively FDI-driven. While foreign players dominate high-tech, domestic firms—anchored in agriculture, textiles, and timber—are reeling from tariff shocks and a global slowdown. Q1 2026 data confirms this stark rift: overall exports surged 19.1% YoY, but domestic players saw a 16.6% contraction (capturing just 19.9% of the pie), while the FDI sector skyrocketed 33.3% to command a staggering 80.1% market share.
 .
.
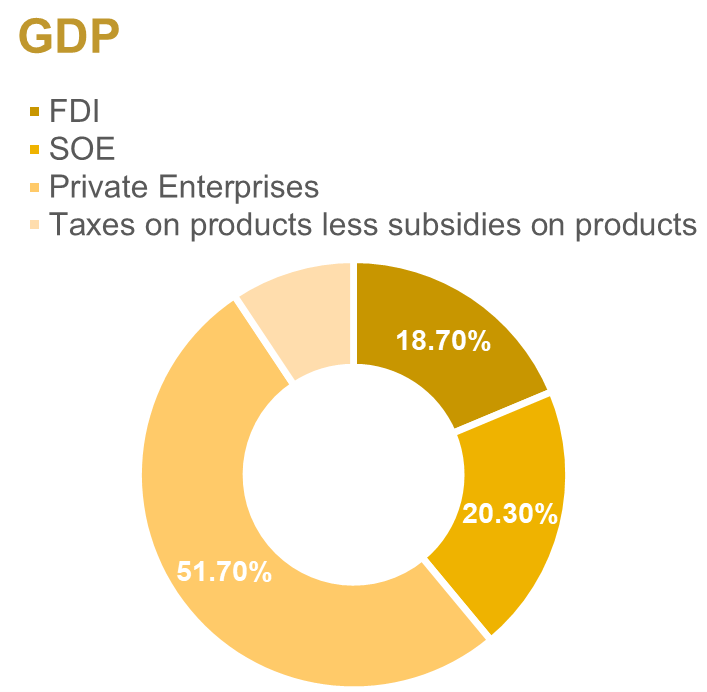
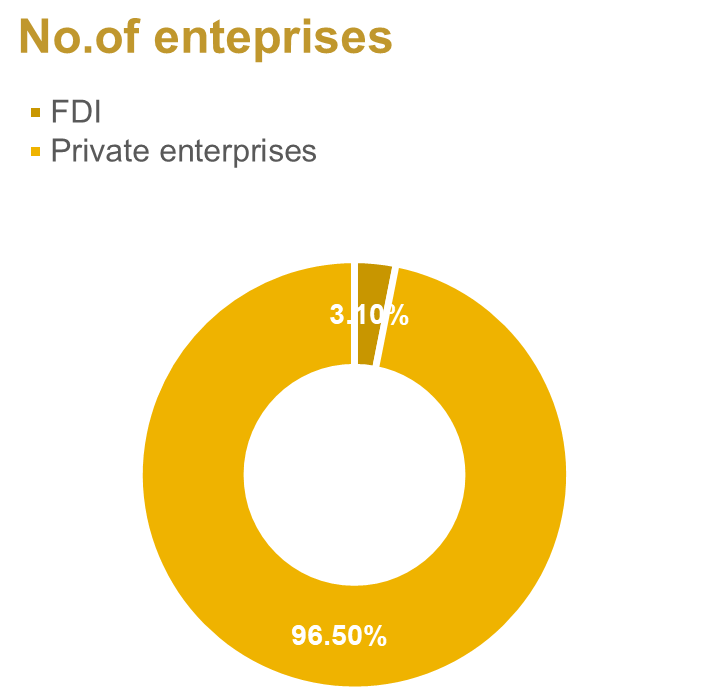
Per GSO data, despite representing 96.5% of total enterprises, the private sector contributed just 51.7% to 2025 GDP (compared to 18.7% for FDI and 20.3% for State-owned enterprises). This segment is dominated by SMEs hamstrung by talent, tech, and governance gaps, while currently reeling from tighter tax compliance. Compounding this, the state’s new strategy favoring ‘national champions’ to bolster global competitiveness is inadvertently squeezing SMEs in the near term.
It is evident that the broader populace remains sidelined from this growth. The expansion of ‘national champions’ has yet to yield a trickle-down effect, while the lion’s share of export surpluses remains firmly in the hands of FDI players
The Cost-of-Living Squeeze:
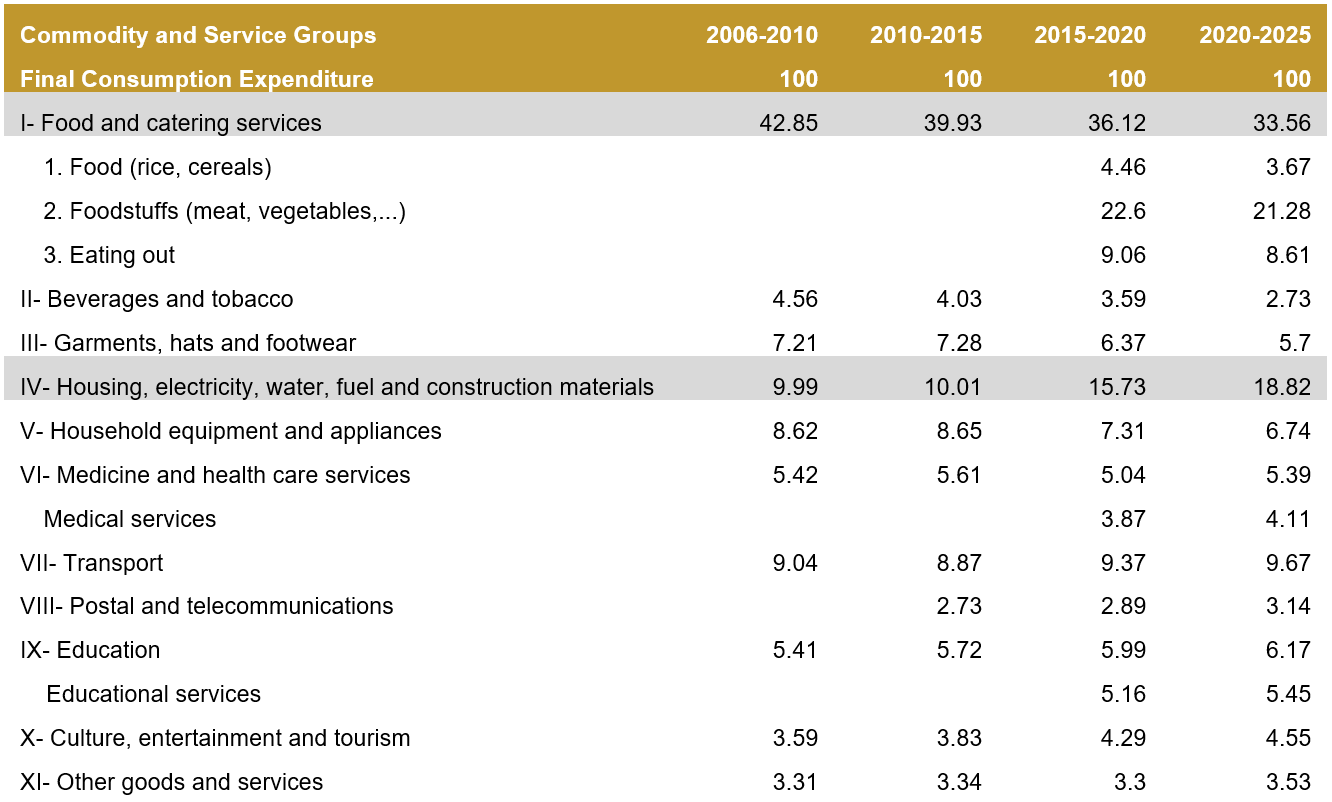
Another catalyst for the ‘K-shaped’ thesis lies in the disconnect between public perception and official CPI data. A breakdown of the GSO’s basket reveals three points: (1) Food and catering services carry an outsized weight of 33.56%; (2) Housing and utilities are bundled into a single category, representing a mere 18.82%; and (3) a lack of granularity, with no clear distinction between urban and rural inflation dynamics.
We believe a fundamental divide exists between urban and rural spending structures. While urban households are more sensitive to service and housing costs, rural consumption is heavily skewed toward food and energy. This structural mismatch means cost shocks—whether in real estate or commodities—hit residents with vastly different intensities depending on their location.
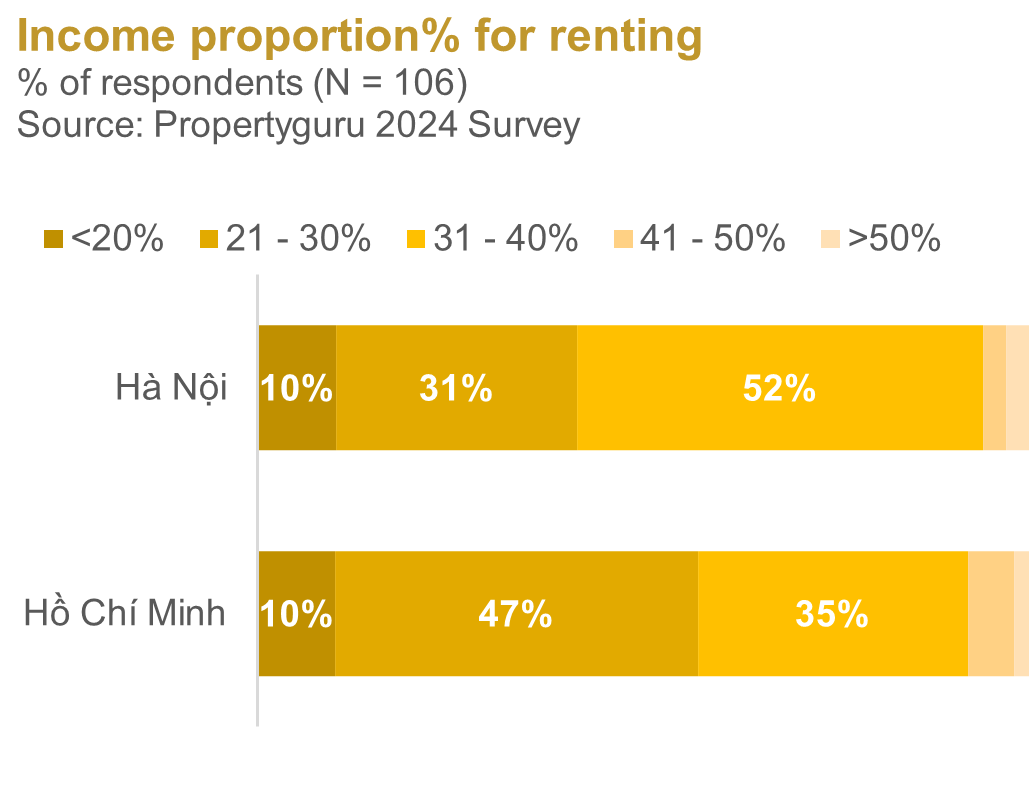
Grouping housing with utilities masks the true pressure of shelter costs. A mere 18.82% weighting fails to reflect urban realities, where housing often consumes 30–40% of household budgets. In contrast, the U.S. CPI assigns a 30% weight to ‘shelter,’ utilizing owners’ equivalent rent (OER). This approach estimates the implicit rent a homeowner would pay to live in their own house if they were renting it from a third party. Essentially, it quantifies the opportunity cost of homeownership—the rental income foregone by choosing to occupy the asset rather than leasing it out at prevailing market rates. By ignoring this imputed rent, official figures may significantly understate the actual cost burden on urban residents.
In Vietnam, the CPI basket only accounts for consumption-based costs—such as actual rent or housing depreciation—while excluding the broader costs of homeownership, including land prices, apartment valuations, and mortgage interest. This approach serves as a stopgap for a market plagued by incomplete and unreliable rental data, while filtering out speculative noise from official inflation figures. However, in an East Asian culture where ‘settling down’ is a paramount life goal and property is viewed as a legacy, this omission profoundly distorts the true cost of living and the psychological burden on households. With Vietnam’s price-to-income ratio at a suffocating 27.3x—among the highest globally—official metrics are increasingly detached from reality.
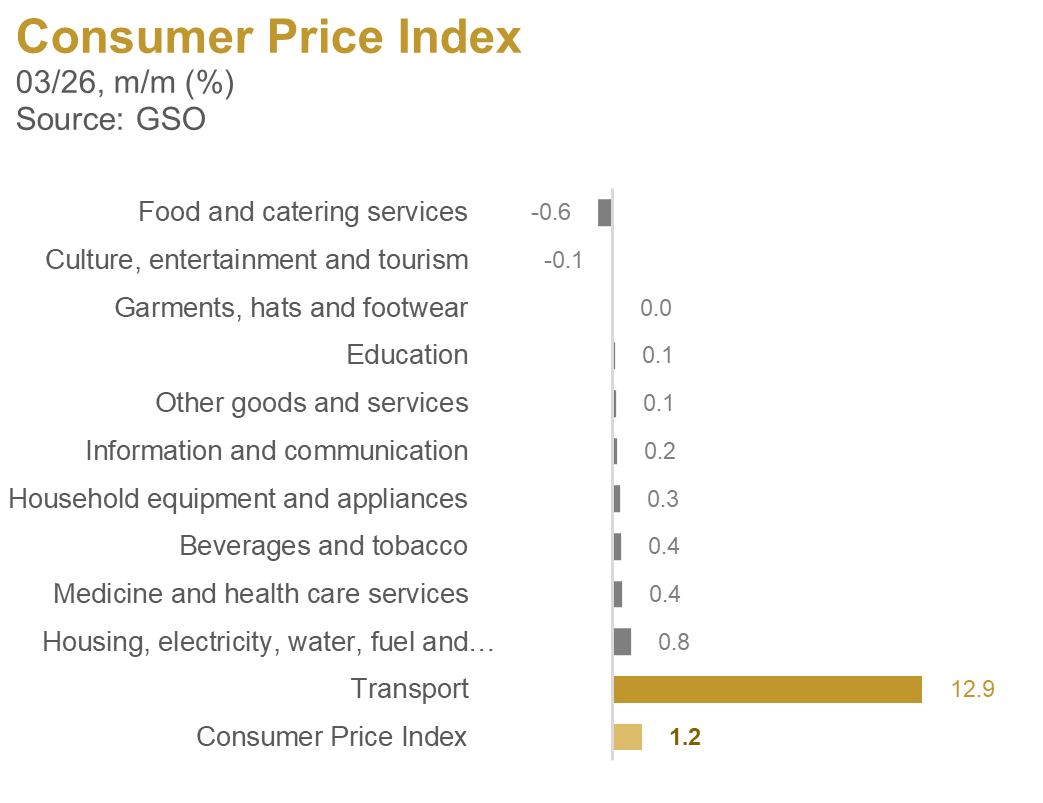
Back to the present: The conflict in Iran has sent Brent futures soaring to $118 per barrel—a staggering leap from $61 at year-end 2025. This energy shock triggered immediate inflationary pressure in March, with the Transport index surging 12.85% and contributing 1.28 percentage points to the headline CPI. We believe this is merely the opening salvo of a prolonged inflationary cycle.
A 2021 IMF study across 190 nations highlights three core findings on inflation sensitivity: (1) In developing markets like Vietnam, the initial pass-through from fuel prices is muted by government subsidies but proves far more persistent and pervasive than in advanced economies; (2) Benchmarking against crude prices rather than retail rates consistently underestimates inflationary heat; and (3) While the distributive impact is progressive, the erosion of purchasing power for low-income households in developing countries lingers for well over a year.
Food and raw materials exert a delayed but amplified inflationary impact across the board, particularly through the food and construction baskets (BIS, 2025). Natural gas is a critical input for nitrogen-based fertilizers like urea and ammonia. Any disruption in LNG supply or spike in prices drives up fertilizer costs, escalating agricultural production expenses. This threatens crop yields and triggers a ‘second-round food inflation wave.
Food and catering services command a dominant 33.56% weight in the CPI basket—a figure that represents an even larger share of a low-income household’s budget. It is evident that the vulnerable population, already struggling in this lopsided economy, will emerge as the biggest losers, falling further behind as commodity prices and living costs surge.
Investment Takeaways:
Investing in a K-shaped recovery demands great active management, as growth will be starkly uneven across sectors and asset classes. Equities and real estate typically serve as the premier hedges against inflation. In this environment, investing early is essential. Stocks edge out real estate due to lower entry costs, enabling you to start as soon as possible.
In this environment, earnings growth and cash flow must serve as the primary North Star. Investors should expect the leaders on the ‘upper arm’ to significantly outpace those trapped in the ‘lower arm’.
1. The Leaders (Upper Arm): Focus on sectors forming the backbone of national development, including construction materials, logistics, power, energy, defense, and telecoms. Investors should target industry titans with clear competitive moats and a track record of genuine profitability. This group is primed to spearhead the initial growth surge.
2. The Laggards (Lower Arm): This group includes sectors that rely on ‘trickle-down’ growth, such as retail, exports, and agriculture. Their recovery is tethered to global headwinds and hinges on the effectiveness of new growth engines combined with state-led redistribution efforts, such as tax incentives and social welfare.
Nguyen Minh Tri – Investment Department, PHFM